Take a moment and imagine this – you’re standing at the crossroads of a busy city street. It’s raining heavily, you’re late for work, and you have two paths to your destination. The path on the left is a straight shot but exposed to the elements, while the path on the right takes you through an underpass, sheltered from the rain but longer.
What is a hypothesis, and what is its role in a statistical study?
It’s essential to remember a hypothesis is different than a research question. A research question is a puzzle you’re trying to solve, like “Does eating more chocolate make people happier?” A hypothesis, on the other hand, is your prediction of the answer, such as, “People who eat more chocolate will report feeling happier.”
We often talk about two types of hypotheses:
- Null Hypothesis: The “No Difference” Statement
- Alternative Hypothesis: The “There is a Difference” Statement
The alternative hypothesis is the hopeful detective in the group. It’s the statement that suggests a difference or connection. In our example, the alternative hypothesis would be: “People who eat more chocolate report feeling happier.”
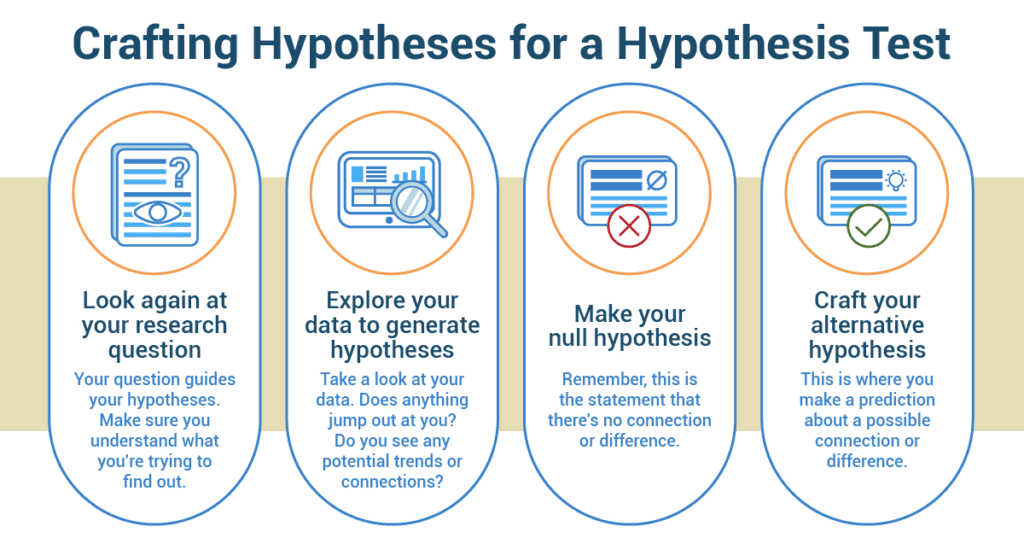
How Do You Craft Hypotheses for a Hypothesis Test?
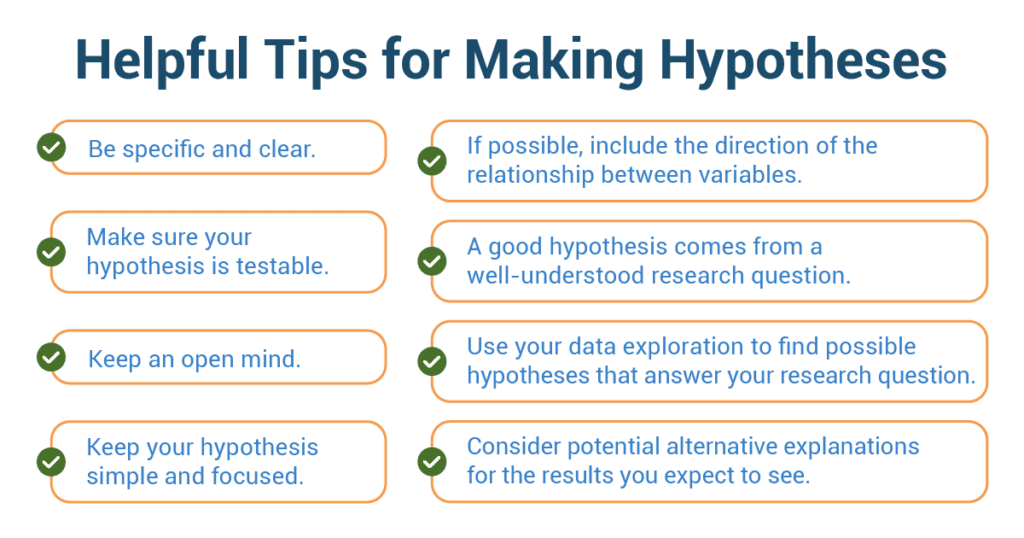
What are Helpful Tips for Making Hypotheses?
As you sharpen your detective skills and dive into your statistical investigation, keep these tips in mind:
- Be specific and clear. A good hypothesis isn’t vague – it’s like a road map that guides your research.
- Make sure your hypothesis is testable. Can you test it with the data you have? If not, you might need to rework it.
- Keep an open mind. Don’t get too attached to your first hypothesis. If the data doesn’t support it, be ready to revise.
- Keep your hypothesis simple and focused. Remember, it’s better to fully understand one thing than to partly understand many things.
- If possible, include the direction of the relationship between variables. Is one thing increasing while the other decreases? Or do they both increase together?
- A good hypothesis comes from a well-understood research question. Spend time understanding your question before jumping into hypothesis-making.
- Use your data exploration to find possible hypotheses that answer your research question. Your data is a treasure trove of clues!
- Consider potential alternative explanations for the results you expect to see. Good detectives always consider all possible scenarios.
Enhancing Growth Rates in Sustainable Fish Culture
In the coastal town of Oceanville, a progressive aquaculture company named “AquaHarvest” had established itself as a pioneer in sustainable fish farming. However, the company’s Research and Development department was grappling with a challenging question – how to optimize the growth rates of their prized “OceanGlow” fish species. To address this, AquaHarvest’s Lead Scientist, Dr. Emily Carter, delved into the world of hypothesis formulation to drive the fish culture to new heights.
Dr. Carter was no stranger to aquatic biology, boasting an extensive background in marine research. Her concern for the growth rates of OceanGlow fish, a delicacy known for its succulent flavor and vibrant colors, was rooted in the company’s commitment to providing healthy and sustainable seafood to consumers. Gathering her team of researchers, Dr. Carter initiated a brainstorming session to formulate hypotheses regarding the growth rates of OceanGlow fish. Recognizing that their fish culture system was complex, she emphasized the need for a clear null hypothesis (H0) and an alternative hypothesis (Ha).
Dr. Carter and her team crafted the null hypothesis, stating that the type of fish feed had no significant effect on the growth rates of OceanGlow fish. This hypothesis acted as the baseline assumption, representing the absence of a meaningful relationship between the variable of interest (fish feed) and the outcome (fish growth). To propose an alternative scenario, Dr. Carter’s team crafted the alternative hypothesis. It posited that specific variations in the type of fish feed did indeed lead to significant differences in the growth rates of OceanGlow fish. This hypothesis was driven by their intuitive belief that different nutritional components could influence fish growth.
Driven by their hypotheses, the team embarked on an ambitious experiment. Over the course of several months, they divided a large batch of OceanGlow fish into three groups. Each group received a distinct type of fish feed: the control group received the standard feed, while the other groups were given feeds enriched with different nutrient profiles. After meticulously recording the fish growth data, the team analyzed the results using statistical methods. Dr. Carter opted for an analysis of variance (ANOVA) test, which would allow them to determine whether there were statistically significant differences in the growth rates among the fish groups.
Upon receiving the ANOVA results, Dr. Carter and her team were intrigued to find that the p-value was well below the significance level. This indicated strong evidence against the null hypothesis, leading them to reject it. The growth rates of OceanGlow fish were indeed influenced by the type of fish feed they received. The significant outcome of the experiment compelled AquaHarvest’s leadership to consider adjusting their fish feed formulations. Dr. Carter’s hypothesis formulation had enabled the team to uncover a crucial factor affecting their fish culture success. With this insight, AquaHarvest took strides toward maximizing the growth rates of their OceanGlow fish, thereby contributing to the company’s mission of providing sustainable seafood to Oceanville and beyond.
Conclusion:
In the realm of fish culture, AquaHarvest showcased the potency of hypothesis formulation in elucidating complex dynamics. Dr. Emily Carter’s strategic approach to crafting hypotheses paved the way for scientific exploration, ultimately propelling the company’s fish farming practices to new levels of innovation and sustainability.

