Imagine yourself standing in the grocery store, in front of the overwhelming cereal aisle. Each box promises you something – fiber, vitamins, sugar, flavor, the list is endless. Each box presents a claim. And in that moment, without even realizing it, you’re running a statistical test. You are deciding whether you believe the claim that the “All-Natural Superfood Granola” will really make you feel energized or whether the “Frosted Sugar Bombs” are truly ‘part of a balanced breakfast.’
In our everyday lives, we are constantly surrounded by claims – in advertising, on social media, in news reports – and we decide whether we believe them or not, often based on some set of evidence, even if we don’t consciously realize it.
Statistical Tests
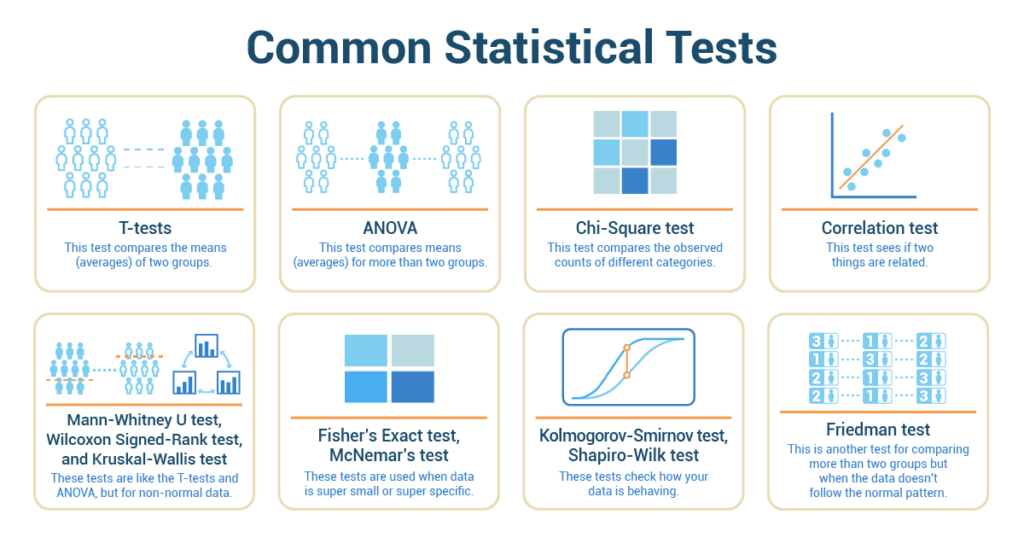
- T-tests: This test compares the means (averages) of two groups. Imagine trying to find out whether the average productivity time is different for 20-year-old men and 30-year-old men.
- ANOVA: Sounds like a star, right? But it actually compares means for more than two groups. Let’s say you want to compare the average exercise time of men in their 20s, 30s, and 40s.
- Chi-Square test: This test is about categories. Like checking if there’s a connection between favorite school subjects and grades.
- Correlation test: This test sees if two continuous variables are related. For example, does the amount of time you spend exercising affect your brain activity?
- Mann-Whitney U test, Wilcoxon Signed-Rank test, and Kruskal-Wallis test: These tests are like the T-tests and ANOVA, but for non-normally distributed data. They’re used when data doesn’t behave as expected, sort of like a wild house party when parents are out of town!
- Fisher’s Exact test, McNemar’s test: These are used when data is super small or super specific. Like comparing the number of employees who prefer chocolate ice cream to those who prefer vanilla in your office.
- Kolmogorov-Smirnov test, Shapiro-Wilk test: These tests check how your data is behaving. Is it normally distributed like a bell curve, or is it a little unusual?
- Friedman test: This is another test for comparing more than two groups, but when the data doesn’t follow the normal pattern.
How to pick the right test
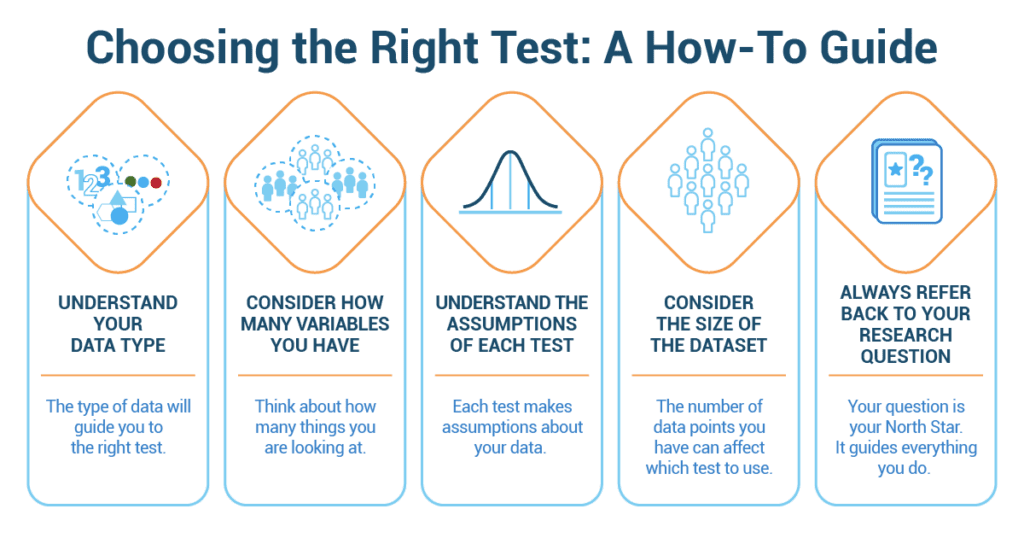
Choosing the right statistical test can feel like choosing a book to read. There are so many options, and each one has a different story to tell! Here’s a handy guide:
- Understand Your Data Type: Look at your data. Is it continuous (like time or weight) or categorical (like favorite color or type of pet)? The type of data will guide you to the right test.
- Consider How Many Variables You Have: Think about how many things you are looking at. Is it one group or two? Or more?
- Understand the Assumptions of Each Test: Each test makes assumptions about your data. Like whether the data follows a bell curve, or if every observation is independent. It’s like checking if you have the right ingredients before you start baking.
- Consider the Size of the Dataset: The number of data points you have can affect which test to use. Some tests work better with larger groups, and others with smaller ones.
- Always Refer Back to Your Research Question: Your question is your North Star. It guides everything you do. Make sure your test answers your question!
Optimizing Shoe Production through Statistical Analysis
In the heart of the footwear industry, “StrideFoot” was a renowned shoe manufacturing company celebrated for its stylish designs and comfort-oriented approach. However, the company’s Chief Operations Officer (COO), Mark Davis, faced a persistent challenge – ensuring consistency in shoe sizes across different production batches. To address this issue, Mark found himself in the world of statistical analysis, tasked with selecting the most suitable statistical test to resolve the sizing discrepancies.
Mark was a seasoned professional with a deep understanding of manufacturing processes. The challenge of maintaining uniformity in shoe sizes compelled him to seek data-driven solutions. His aim was not only to address the current issue but also to establish a sustainable quality control system. A range of shoe sizes was critical to catering to diverse customer needs. However, Mark’s team had noticed variations in shoe dimensions, leading to customer complaints and returns. The COO recognized that they needed a robust statistical approach to identify if the variations were significant and, if so, how they could be minimized.
In a brainstorming session with his quality control team, Mark emphasized the importance of understanding the variables at play. They identified the shoe size measurements as the primary focus and the production batches as the categories to compare. Mark likened this to comparing the performance of different car models based on their fuel efficiency. Given the nature of their challenge – comparing means of multiple groups – Mark opted for an analysis of variance (ANOVA) test. He explained that ANOVA would allow them to assess whether the variations in shoe sizes were statistically significant across different production batches.
The quality control team compiled shoe size measurements from several production batches. Mark ensured the data was accurate and representative of the entire production process. With the data ready, the team ran the ANOVA test. The test output provided information about the variation between the production batches and the variability within each batch. Mark and his team examined the ANOVA results closely. The F-statistic and p-value provided valuable insights. A low p-value would indicate that the variations in shoe sizes were indeed significant.
When the results indicated a low p-value, Mark knew that there were significant differences in shoe sizes among production batches. This discovery prompted him to collaborate with the design and production teams to identify potential factors causing the variations. Armed with statistical insights, StrideFoot undertook initiatives to standardize manufacturing processes, reduce material variability, and improve quality control protocols. As a result, they began to notice a decrease in customer complaints related to inconsistent shoe sizes.
Conclusion:
In the world of footwear manufacturing, StrideFoot demonstrated the power of statistical analysis in addressing production challenges. Mark Davis’ informed decision to choose the ANOVA test allowed the company to pinpoint significant variations in shoe sizes and take targeted actions for improvement. By leveraging statistical tools, corporate professionals like Mark played a crucial role in enhancing product quality, customer satisfaction, and overall business success in the highly competitive shoe industry.

