Hey guys! It’s Chip, and I’m here to talk about descriptive statistics! 📊
Descriptive statistics are used to summarize and describe data. The goal of descriptive statistics is to provide a quick and easy way to understand the data and to identify any patterns or trends.
So, what are the two main things that descriptive statistics measure? They measure central tendency and spread.
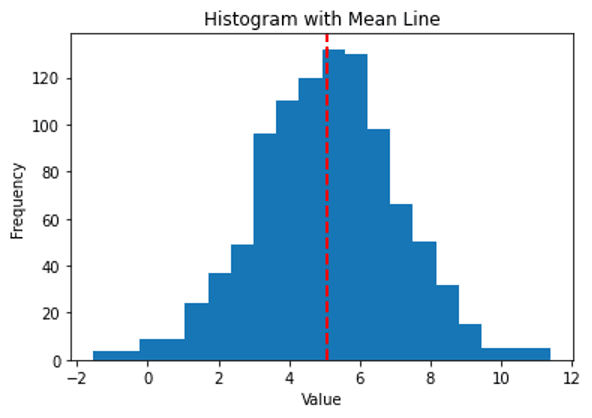
🎯 Central tendency: Central tendency is a measure of the center of a distribution. It tells us where the “typical” or “average” value is. Measures of central tendency include the mean, median, and mode. For example, if we look at the ages of a group of people, the mean age is the sum of all the ages divided by the number of people. The median age is the middle age of all the people when they are arranged in order.

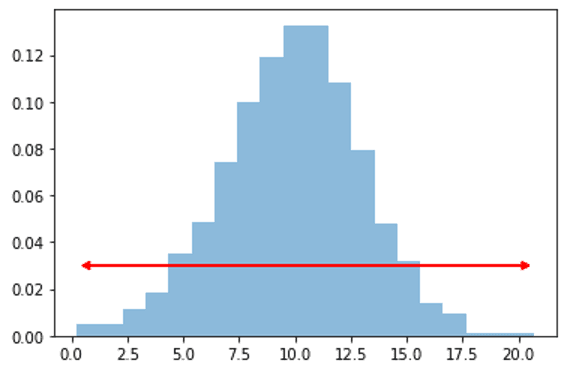
🎯 Spread: The spread of a distribution tells us how much variation or variability there is in the data. It measures how far apart the values are from each other. Measures of spread include range, variance, and standard deviation. For example, if we look at the weights of a group of fruits, the range is the difference between the heaviest and lightest fruit. The variance and standard deviation measure how much the weights vary from the mean weight.

So, why is it important to explore variation in a distribution?
Real-life observations tend to be different from one observation to the next. For example, if we measure the height of a group of people, we’re likely to get slightly different results for each person. By exploring variation in the data, we can understand how the data is spread out and whether there are any unusual patterns or outliers in the data.
In summary, descriptive statistics are used to summarize and describe data. They measure central tendency and spread to help us understand the typical or average value and the variation in the data. Exploring variation in distribution is important to help us understand how the data is spread out and to identify any unusual patterns or outliers.