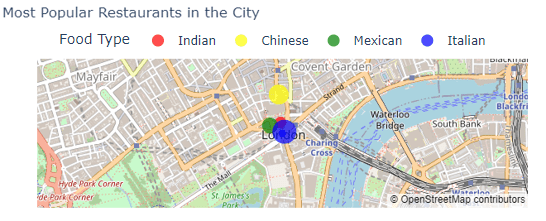
In this article, we’re going to talk about a very interesting and useful type of data visualization: a map with markers. You might have seen these kinds of maps when you’re checking out local businesses, browsing real estate listings, or even looking at the spread of a disease in different regions. These maps help us understand the distribution and location of data points in a more intuitive and visual way.
So, what exactly is a map with markers? It’s essentially a map with little symbols, often called markers, to represent specific data points or locations. The markers can vary in shape, size, and color to show different types of information.
A map with markers can answer questions such as:
- What are the locations of specific data points or events?
- Are there any spatial patterns or clusters in the data?
Imagine you’re reading a news article about the most popular restaurants in your city. The article might include a map with markers showing the locations of these top-rated eateries. The markers could be color-coded based on the type of cuisine, and their size could represent the number of positive reviews each restaurant has received. This way, you can quickly and easily see the distribution of these popular restaurants and perhaps find a new place to try!

To help illustrate the concept further, let’s go through some other examples of how maps with markers can be used:
- Disease spread: You might have seen a map showing the number of COVID-19 cases in different regions. Markers could be used to represent the number of cases in each region, with the size of the marker indicating the total number of cases. This helps us understand which areas have been affected the most and track the progress of the disease over time.
- Real estate listings: When you’re searching for a new home, websites often show you a map with markers representing available properties. The markers can be color-coded to indicate the price range or property type, making finding the perfect home in your desired area easier.
- Travel planning: If you’re planning a vacation, you might use a map with markers to see the locations of various attractions, hotels, and restaurants. This can help you plan your itinerary and make sure you’re making the most of your time in a new city.
So, maps with markers are a powerful tool for visualizing and understanding location-based information. They can help us quickly grasp the distribution of data points and identify trends or patterns in a way that would be difficult to do with just numbers or words.