I’d like you to think about a cherished photo album you have at home. 📸 Each picture tells a story, right? You remember the day, the time, the people, the smiles, the emotions. But what about those forgotten stories? The ones where the details are lost with time, like the precise day of the photo or the location. It’s frustrating, isn’t it? 😭 Now imagine what if every picture you had was automatically tagged with details like the date, the location, the people in it, the camera used, or even the weather that day. It’d be like having a time machine, wouldn’t it? Suddenly, the pictures aren’t just visual memories anymore; they are rich stories filled with context, enabling you to relive those moments more vividly.
Well, in the world of data, the extra information, the ‘who,’ ‘what,’ ‘where,’ ‘when,’ ‘how,’ and ‘why,’ is what we call metadata.
Now, I know metadata sounds very technical, even a bit intimidating, but believe me when I say you’ve been dealing with it and using it in your everyday life without even realizing it. From Google searches and digital photos to the books you order online – metadata is everywhere, weaving context into our data-saturated lives. It is the invisible layer of information that helps us make sense of the world around us, much like those details in your photo album.
By the end of this article, I want to take you on a journey from understanding the basic concept of metadata to exploring its vast possibilities to finally seeing it as an unsung hero that adds context, depth, and richness to our digital lives. Because, my friends, in this vast universe of data, metadata is the lens through which we can transform raw data into meaningful insights.
What to Think About When Exploring the Context of Your Data

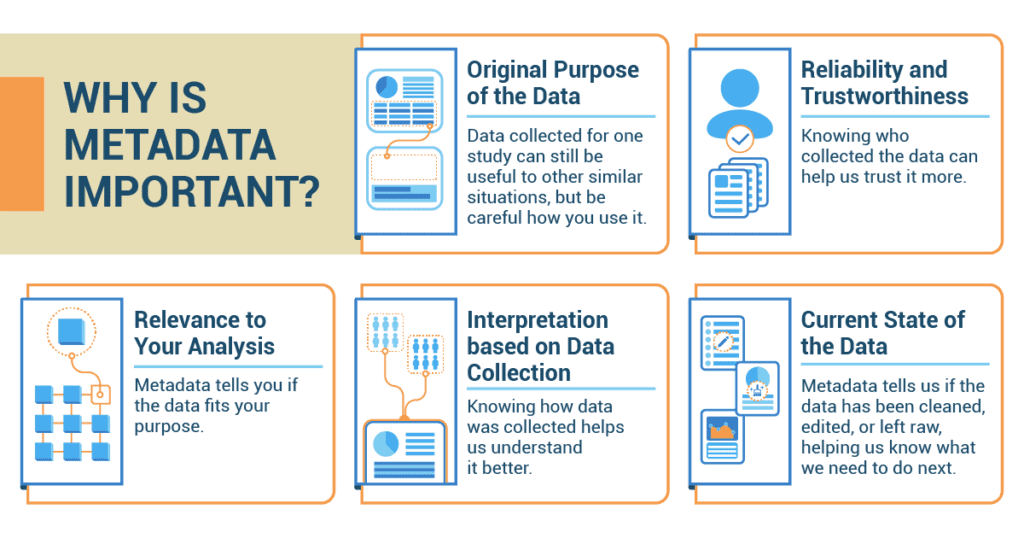
Just like a soccer game is more fun when you know the teams playing and the rules, data also becomes more understandable when you know its context. This is where metadata shines! The context of your data helps you understand the following:
- Original purpose of the data: Imagine you’re studying the effects of video games on grades. If you know the data was collected to study the popularity of video games, it can still be useful, but you’ll need to be careful how you use it.
- Reliability and trustworthiness of the data: Knowing the source and collection details helps assess the reliability of the data by evaluating the credibility and validity of the data collection process. It’s like knowing if your information about the latest movie comes from a professional movie critic or a random person on the internet.
- Data’s relevance to your analysis: Metadata tells you if the data fits your purpose and is meaningful to the topic. If you’re studying high school video game habits, but the data is about elementary school kids, it may not be useful.
- How to interpret the data based on data collection: Knowing how data was collected helps us understand it better. If the data came from a survey asking students about their video game habits, we know it’s based on their memory and honesty.
- The current state of the data: Metadata tells us if the data has been cleaned, edited, or left raw, helping us know what we need to do next.
How Does Metadata Support Understanding of the Context of the Data
Here are some questions metadata can answer when exploring the context of your data. Let’s keep using our video game example:
- Why was the data collected? Maybe the data was collected to see what games are popular among high school students.
- Who collected the data? Maybe it was a video game company looking for the next big game idea.
- What is the scope of the data?
- Location: Does it cover all high schools or just some?
- Time period: Was it collected last month or five years ago?
- What were the collection methods?
- Methodology: Was it an online survey, in-person interview, or observation?
- Collection tools: Maybe an app tracked play times on a smartphone.
- Were there any data transformations? Has the data been edited or cleaned already? If your data has been collected over a long time period, metadata can help track any changes in the data collection process, measurement methods, or definitions that could affect your analysis.
- How was missing data handled? If a student didn’t answer a question, was it left blank or filled with a guess?
Best Practices and Tips

Now, being a great detective means being careful:
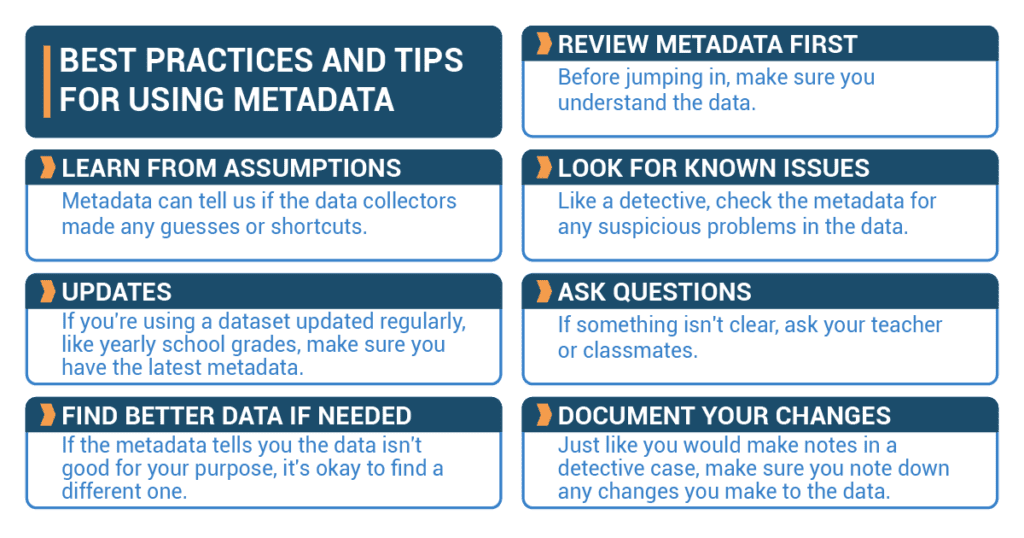
- Review metadata first: Before jumping in, make sure you understand the data.
- Learn from assumptions: Metadata can tell us if the data collectors made any guesses or shortcuts.
- Look for known issues: Like a detective, check the metadata for any suspicious problems in the data.
- Updates: If you’re using a dataset updated regularly, like yearly school grades, make sure you have the latest metadata.
- Ask questions: If something isn’t clear, don’t hesitate to ask questions.
- Find better data if needed: If the metadata tells you the data isn’t good for your purpose–irrelevant, inaccurate, out-of-date, or unsuitable in some other way–it’s okay to find a different one.
- Document your changes: Just like you would make notes in a detective case, make sure you note down any changes you make to the data.
Remember, metadata is your trusty sidekick in the journey of statistics. Use it wisely, and you’ll become the Sherlock Holmes of data!
Striking a Chord: Alex’s Symphony of Data
 In the heart of Seattle, Alex, a high school junior and music enthusiast, found himself in the middle of an intriguing investigation. As part of his summer statistics project, he had chosen to analyze the impact of different music genres on student study habits.
The dataset Alex obtained contained a wealth of information – thousands of survey responses from students across the U.S., each detailing their favorite genre, average hours spent studying, and academic performance. However, Alex knew that these raw numbers were only half of the story. To draw meaningful conclusions, he needed to understand the context, the life behind these numbers – and for this, he turned to metadata.
Initially, Alex took note of who collected the data. Seeing that it was a collaboration between a well-regarded university and a popular music streaming platform, he felt reassured about its reliability. Next, he dug into the reason the data was collected: to study patterns in students’ musical preferences. This wasn’t an exact match to his project, but Alex believed the data could still provide valuable insights.
Delving deeper, he found that the data had been collected over the course of the previous academic year and had been evenly sampled from all four grade levels. Alex knew this was important, as it helped ensure the dataset was representative of the high school student population at large. He also found out the data represented students across various U.S. states, giving his analysis a broader, more diverse context.
Turning to the data collection method, Alex discovered that it was a voluntary online survey. He noted down this crucial piece of metadata because voluntary surveys sometimes have biases, with certain types of people more likely to participate than others. He would need to bear this in mind when interpreting his results.
The metadata also revealed that some transformations had been applied to the data. For example, outliers – those students who reported studying for an unlikely number of hours each day – had been removed. Alex appreciated knowing this, as it meant the data was already partially cleaned, making his task a bit easier.
Finally, Alex noticed that missing data had been handled by keeping the original blank responses. This approach respected the integrity of the original data, but it also meant Alex would have to decide how to handle these blanks in his own analysis.
Armed with the richness of the metadata, Alex felt well-equipped to dive into his analysis. No longer just a mountain of numbers, the data was now imbued with context, the real-world “music” behind the information. As he began his exploration, Alex knew he was conducting more than just a school project – he was orchestrating a symphony of data.