Imagine you’re stepping into a mobile phone store. As you enter, you’re greeted by a vast display of smartphones. 📱Hundreds of models from various brands are sprawled across the shelves, mingling without any discernible order. It’s a chaotic sight, leaving you unsure of where to begin your search for the perfect phone. 😫
Now, let’s consider a different scenario. You walk into another mobile phone store, but this time, the devices are meticulously organized. Each phone has its designated section, with clear labels indicating the brand, model, features, and price range. You effortlessly navigate through the store, quickly narrowing down your options to the desired specifications. Within minutes, you find yourself holding a promising phone in your hands.
Both stores offer the same quantity of information—countless mobile phones. However, it’s the organization of this information, the metadata, that determines whether you feel overwhelmed or can easily find what you’re looking for.
Metadata plays a crucial role in our everyday interactions, often unnoticed. It serves as the invisible framework that guides us through the vast amount of information we encounter. Metadata is the categories and descriptions on e-commerce websites, the specifications on product labels, the user reviews and ratings, and the filters that refine search results. It exists all around us, making sense of the digital landscape and transforming it into manageable, meaningful pieces.
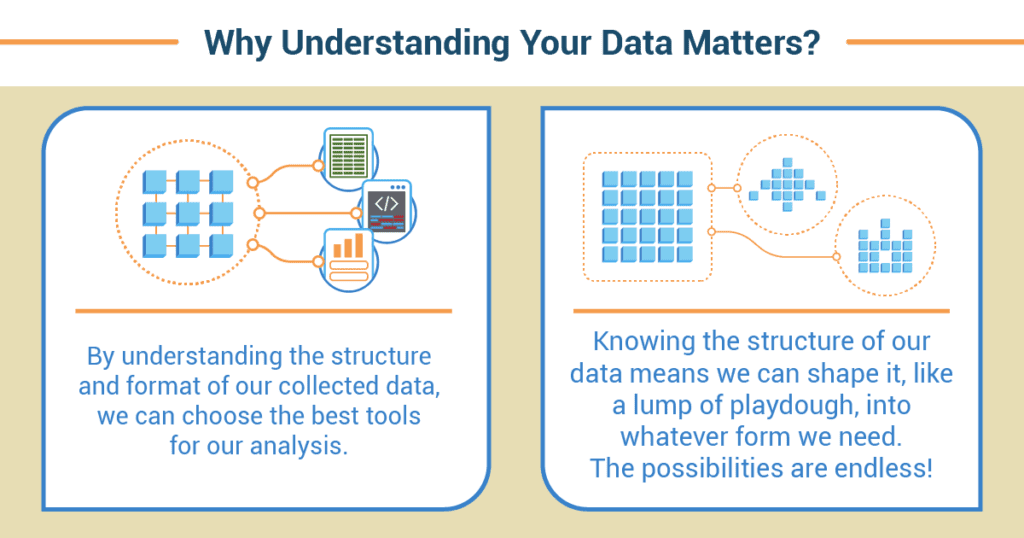
Why Understanding Your Data Matters

Let’s pretend we’re planning the ultimate pizza party for the whole school. We’ve collected data on everyone’s favorite toppings, but we have a lot of tools at our disposal to make sense of this data.
- By understanding the structure and format of our data (are the favorite toppings listed by name? By popularity?), we can choose the best tools for our analysis.
- Knowing the structure of our data means we can shape it, like a lump of playdough, into whatever form we need. We could sort it alphabetically to find the most and least popular toppings quickly. We can filter it to see if seniors have different topping preferences than first-year students. We can aggregate it or reshape it to derive meaningful insights. The possibilities are endless!
Use Metadata to Explore the Structure and Format of Your Data

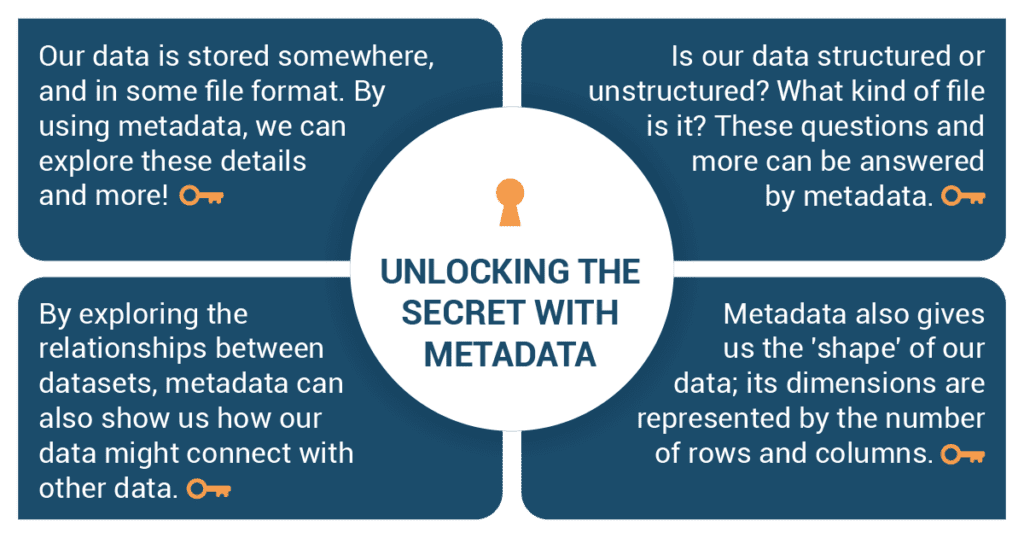
- Explore how data is stored. Our data isn’t just a list of pizza toppings. It’s stored somewhere (on a computer, in the cloud) and in some format (maybe as a spreadsheet or a text document). By using metadata, we can explore these details and more.
- Is our data structured (organized like a table) or unstructured (more like a big messy pile of toppings)?
- What is the file type (CSV, Excel, etc.)? Different file types have specific structures and encoding methods. Understanding the file type helps in interpreting the data correctly.
- Explore the relationships between datasets. Metadata can also show us how our pizza toppings data might connect with other data. Maybe we have another dataset that tells us which toppings are most healthy or cheapest. By exploring the relationships between datasets, we can create a full picture of our pizza party plan.
- Explore the dimensions or shape of your data. Metadata gives us the ‘shape’ of our data, the different aspects or variables that are being measured or observed within a dataset. Just like a pizza can be round or square, our data has dimensions. These are simply the number of rows (like the number of students surveyed) and columns (like different toppings they could choose).
Top Tips and Tricks with Metadata

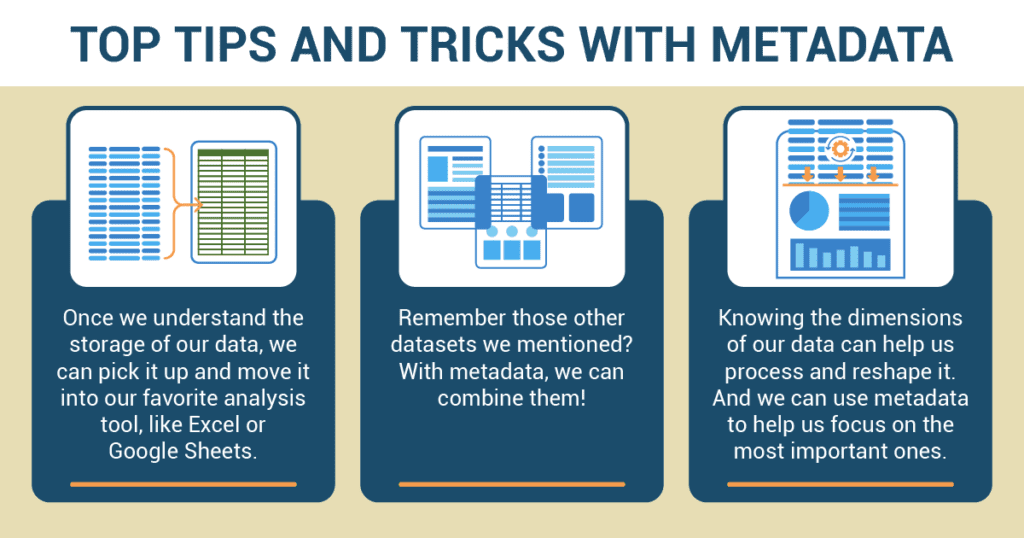
Once we understand the storage of our data, we can pick it up and move it into our favorite analysis tools, like Excel or Google Sheets.
And remember those other datasets we mentioned? With metadata, we can combine them! It’s like adding more toppings to our pizza. We can see if the most popular toppings are also the most expensive or the least healthy.
Finally, knowing the dimensions of our data can help us process and reshape it. If we have too many toppings to look at all at once, we can use metadata to help us focus on the most important ones.
So there you have it, young detectives! By understanding and using metadata, you’ll be well on your way to solving any data mystery that comes your way. And maybe even throwing the best pizza party your school has ever seen!
Lost in the Cosmos: How Lily Unearthed Galactic Secrets through Metadata
 A chill Tuesday morning greeted Lily as she sat in her high school computer lab, sipping her hot chocolate. Astronomy was her passion, and the school had provided her with a unique opportunity: analyzing a massive dataset about celestial bodies that the local university had shared. It was her mission to uncover patterns and insights about our galaxy. However, staring at this colossal mountain of raw data was daunting. It seemed like trying to find a single star in the night sky.
Recognizing that diving headfirst into the data wouldn’t be effective, Lily opted for a smarter approach: using metadata to explore the structure of the dataset. The metadata was like a map to the vast universe encapsulated within those numbers and figures.
She first examined the way the data was stored. It was in a CSV format, which was compatible with the software she was familiar with, like Excel and Python. This made her confident she could interact with the data without compatibility issues.
To understand the structure of the data, Lily inspected how it was organized. It was a structured dataset, meaning the data was organized in a table-like manner, with different columns representing properties like ‘Star Name,’ ‘Constellation,’ ‘Star Type,’ ‘Distance,’ etc. Understanding this was crucial because it allowed Lily to conceptualize the dataset and predict the kind of manipulations she might need to make.
Next, she explored the relationships within her dataset. By using the metadata, Lily could see connections. For instance, she noticed how the ‘Star Type’ column related to ‘Brightness’ and ‘Temperature.’ This relational understanding hinted that there might be interesting patterns to uncover between these variables.
Checking the dimensions of her data, Lily found the number of rows and columns in her dataset. Knowing how expansive her dataset was helped her plan the computational resources she would need. It also helped her to estimate the time she’d need to process and analyze the data.
Armed with her metadata-derived insights, Lily started her space adventure. She noticed the ‘Star Type’ and ‘Brightness’ correlation and set off to test her hypothesis: Do more massive stars tend to be brighter? Her exploration led her to intriguing patterns and insights that echoed the rhythm of the cosmos.
Through the lens of metadata, Lily managed to find her way through the intricate web of cosmic information. She wasn’t lost in the cosmos anymore; instead, she was becoming a guide, shedding light on the hidden patterns of the stars.