I want you to take a moment and think about your favorite library. Picture the rows and rows of books, each one filled with a unique story, a vast wealth of information.
Now, if I were to ask you to find me a book, let’s say, on ’16th-century Italian art,’ how would you do it? You wouldn’t randomly start opening books, hoping to stumble upon it, right? You would probably go to a particular section, perhaps ‘Art History,’ 🎨 then narrow it down to ‘Renaissance,’ and so on until you find your book. Now, how did you do that? ❓The answer is simple – by relying on a system of classification, the ‘metadata’ if you will, that tells you what each book is about, who wrote it, when it was published, etc.
Imagine now, if we didn’t have this classification, this metadata, your local library would be a chaotic mess, wouldn’t it? The truth is, whether we realize it or not, we rely on metadata every single day. It helps us make sense of the world around us.
And it’s not just books. Think about when you buy groceries online. 🛒 You know exactly where to find what you need – dairy, fruits, vegetables, meats, baking supplies – all neatly categorized. Or when you scroll through your favorite music streaming service, searching for songs by genre, artist, or album. 🎵 That’s all metadata at work.
Just as metadata helps you navigate a library or an online shopping platform, it plays a crucial role in helping us make sense of complex datasets in the world of data analysis.
What is Metadata?
Simple – it’s data about data.
Just as the title, author, and summary on a book cover tell us about the book, metadata tells us important details about our data. It’s like a recipe that tells us what ingredients we need, how much to use, and how to mix them together.
Types of Metadata
- Descriptive: This type of metadata describes the content and characteristics of a particular resource. It includes information such as title, author, subject, keywords, abstract, date created, and other details that help identify and categorize the resource.
- Structural: Structural metadata describes the organization and relationships between different components of a resource. For example, in a website, structural metadata may include information about the hierarchy of web pages, navigation menus, and the relationships between them.
- Administrative: This type of metadata provides information about the administrative aspects of a resource, such as its ownership, access rights, file format, file size, creation date, version history, and other technical details that help manage and maintain the resource.
How Does Metadata Help Us?

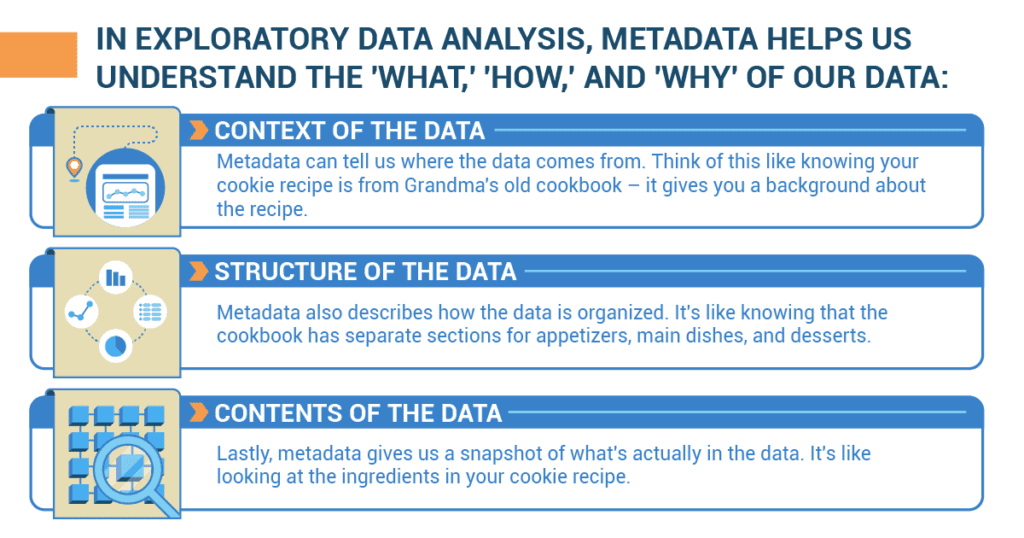
In exploratory data analysis, where we’re trying to find out what our data can tell us, metadata is a secret map. It helps us understand the ‘what,’ ‘how,’ and ‘why’ of our data. Here are some questions metadata helps us answer:
- What is the context of the data? Metadata can tell us where the data comes from. Think of this like knowing your cookie recipe is from Grandma’s old cookbook – it gives you a background about the recipe. For example, if you’re looking at the data about student grades in your school, the metadata can tell you which year it’s from, what subjects are included, and who collected it.
- What is the structure of the data? Metadata also describes how the data is organized. It’s like knowing that the cookbook has separate sections for appetizers, main dishes, and desserts. In our grades example, the structure could be how the data is arranged – by grade level, then by subject, then by individual student.
- What are the contents of the data? Lastly, metadata gives us a snapshot of what’s actually in the data. It’s like looking at the ingredients in your cookie recipe. With grades, the contents could be the actual scores that each student received in each subject.
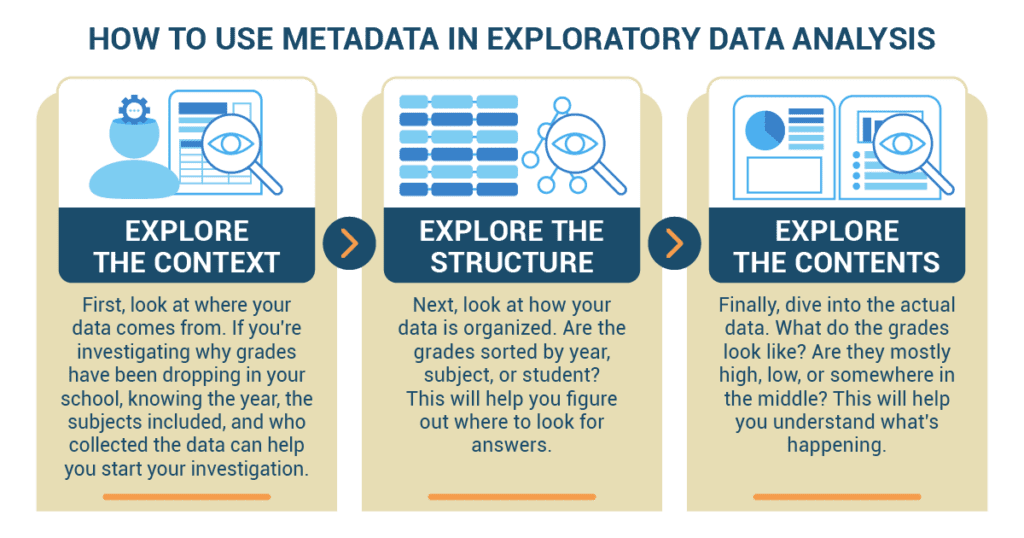
How Do We Use Metadata in Exploratory Data Analysis?

- Explore the context: First, look at where your data comes from. If you’re investigating why grades have been dropping in your school, knowing the year, the subjects included, and who collected the data can help you start your investigation.
- Explore the structure: Next, look at how your data is organized. Are the grades sorted by year, subject, or student? This will help you figure out where to look for answers.
- Explore the contents: Finally, dive into the actual data. What do the grades look like? Are they mostly high, low, or somewhere in the middle? This will help you understand what’s happening.
With the understanding of these steps, you can clean up your data (like sorting out irrelevant information), explore further, and interpret your findings.
Sasha’s Slam Dunk: How Metadata Assisted in Her Sports Analysis Project
 Sasha, a sophomore at Northville High, was tasked with a school project in her Statistics class. The project was a deep dive into the school’s athletic department performance over the past decade. Coach Johnson had given Sasha access to a decade’s worth of scores, team rosters, and game logs for the school’s basketball and football teams. It was an ocean of numbers and names, all mixed together.
At first glance, Sasha was overwhelmed by the sheer volume of data. It was like looking at a giant jigsaw puzzle with no image to guide her. Then, she remembered a lesson from class about the importance of metadata in exploratory data analysis.
To make sense of the data, Sasha realized that she needed to understand its context – the first facet of metadata. She noticed that the data was collected from various sources, including coach Johnson’s personal records, school archives, and even local newspaper reports. By acknowledging these sources, Sasha understood the diverse origins of her data, crucial for the next steps.
Next, Sasha had to understand the structure of the data – the second facet of metadata. The data were grouped by sport, by year, and within each year, it was organized by the game. She could see that the basketball data was arranged separately from the football data. Also, within each sport, the data was organized seasonally, and each game was recorded chronologically. This structure was like a roadmap, guiding Sasha through her vast landscape of information.
Finally, she moved to the contents of the data – the third facet of metadata. Here, she found the individual scores of each game, the names of the players, the positions they played, and even notes on weather conditions. It was like having a bird’s eye view of every game that had been played in the last decade.
With a clear understanding of the metadata, Sasha began her exploratory data analysis. She discovered trends in both the basketball and football teams’ performance over the years. She noticed patterns linked to specific players, identifying key contributors to the team’s success. Sasha also observed that the football team tended to score fewer points in games played in rainy conditions, an insight only possible due to the metadata about weather conditions included in the game logs.
In the end, Sasha’s deep understanding and use of metadata transformed a daunting pile of data into a meaningful analysis of Northville High’s athletic performance. She delivered a compelling presentation that not only earned her an ‘A’ in Statistics but also caught the attention of coach Johnson, who saw the value in analyzing metadata and decided to incorporate it into his future game strategy planning.