Table of Contents
ToggleWhat Is a Correlation Matrix?
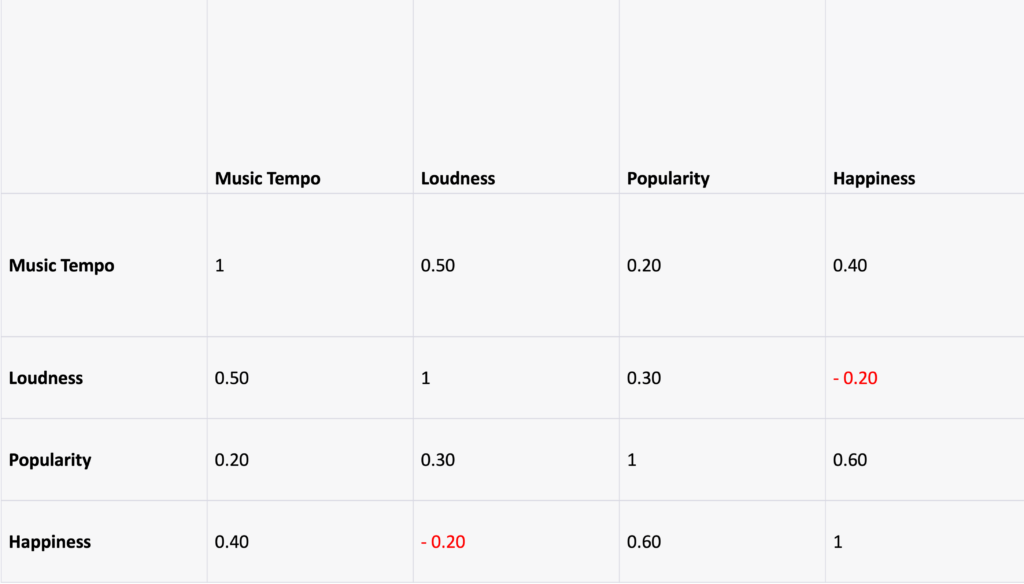
A correlation matrix is a table that displays the correlation between multiple variables. It’s like a cheat sheet that shows us how closely related different variables are.
In a correlation matrix, each variable is represented by a row and a column, and the cells show the correlation between them. The number in each cell represents the strength and direction of the correlation, with positive numbers indicating positive correlations (when one variable increases, the other variable tends to increase) and negative numbers indicating negative correlations (when one variable increases, the other variable tends to decrease).

For example, if we’re studying the relationship between the type of music we listen to and our mood, a correlation matrix might show how closely related different types of music are to different moods, such as happiness or sadness.
How to Read a Correlation Matrix?
In this section, we will learn how to read a correlation matrix, a vital skill for understanding the relationships and strengths of association between multiple variables:
- Look at the number in each cell to see the strength and direction of the correlation.
- Positive numbers indicate positive correlations, while negative numbers indicate negative correlations.
- The closer the number is to 1 (or -1), the stronger the correlation.
- A number of 0 means there is no correlation between the two variables.
Understanding correlation matrices can help us identify patterns and relationships between multiple variables. So next time you’re analyzing data with many variables, think like a mathematician and use a correlation matrix!
