How Do Outliers Impact a Correlation Coefficient?
Outliers are data points that are significantly different from the other data points. They can have a big impact on a correlation coefficient, which is a number that measures the strength and direction of the linear relationship between two variables. 📈📉
Imagine you’re in a class and you get a very low grade on one test. This grade will bring down your overall average, even if you did well on all the other tests. Similarly, an outlier can bring down the correlation coefficient, even if the other data points show a strong linear relationship.

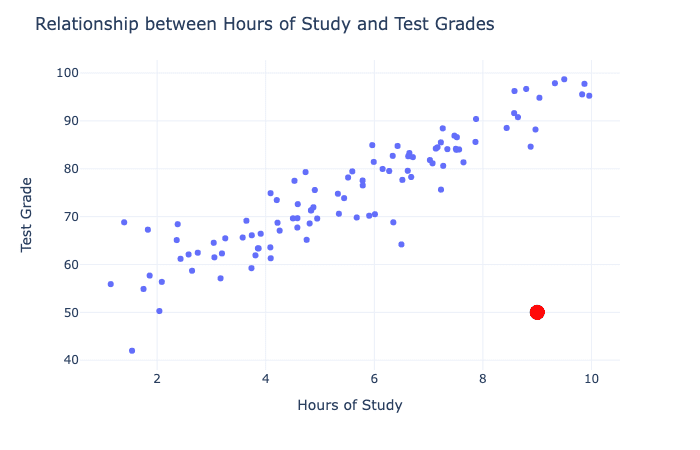
👉 For example, let’s say we’re studying the correlation between the number of hours spent studying and the grade on a test. Most of the data points show a positive linear relationship, but there’s one data point that shows a very low grade even though the student studied a lot. This outlier can decrease the correlation coefficient and make it look like there’s no relationship between studying and grades.
Outliers can also have the opposite effect and increase the correlation coefficient. This can happen when the outlier is aligned with the overall pattern of the data, and its inclusion strengthens the linear relationship.
👉 For example, let’s say we’re studying the correlation between the height and weight of a group of people. Most of the data points show a positive linear relationship, but there’s one data point that shows a very tall and heavy person. This outlier can increase the correlation coefficient and make it look like there’s a stronger relationship between height and weight than there actually is.
📊 Understanding how outliers impact a correlation coefficient can help us interpret our results correctly and avoid making incorrect conclusions. So next time you’re analyzing data, think like a detective and look out for outliers! 🕵️♀️🔎