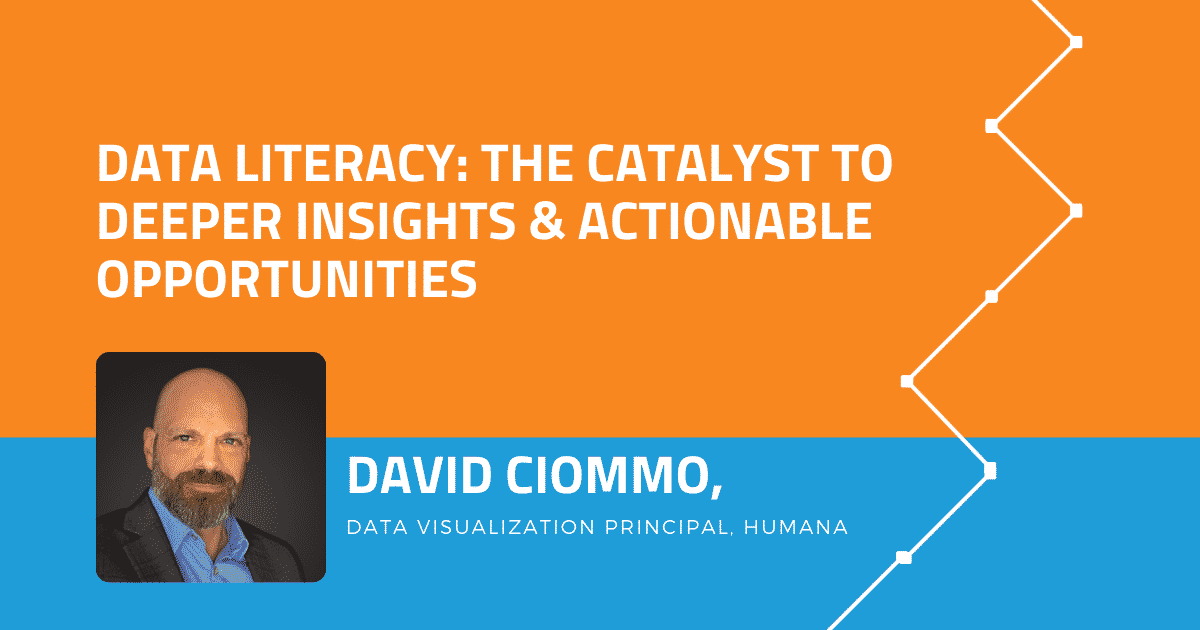
Last month we had the privilege of hosting
David Ciommo, Data Visualization Principal at Humana, for a webinar, “Data Literacy: The Catalyst to Deeper Insights & Actionable Opportunities.” David’s career started in graphic design and has evolved into a passion for data literacy, data visualization, and data storytelling.
Watch David’s full presentation here.
Why does Data Literacy Matter?
Data literacy matters for a multitude of reasons – some easily quantifiable and some less so. But, at the end of the day most managers are saying, “Show me the money!” David brought out 2 key financial stats around data literacy:
- Enterprise value increases $320-$534 million with higher data literacy experience. “Uplift in data literacy = uplift in enterprise value.”
- Employers are willing to pay 10-20% more in compensation for data-literate employees.
In short, the financial implications of data literacy benefit both company performance and employee opportunities. This alone might have you asking, “where do I start?”
David references a recent QuantHub blog on
data literacy that is a good starting point. In addition, our team would love to show you our upskilling platform that helps increase data literacy in just 10 minutes a day.
It Starts with a Story.
Science has proven we consume visuals 60,000 times faster than numbers and words, so why do we keep giving people spreadsheets of information?
This is the reason data storytelling and data visualization are crucial skills in learning how to communicate, read, and argue with data. A big challenge with data is that there is so much of it. Data is everywhere and it’s being created at a dizzying pace, and some data points are more important than others.

Only 5% of individual statistics are remembered, but 63% of stories are remembered.
David shared that a common practice when employees start using data storytelling is that they bring data into a tool, apply some visuals, and along the way figure out what to say. He recommends a different approach:
- First, look at the data and decide what story you want to tell with it.
- Answer critical questions:
- What are you trying to say?
- Who is your audience?
- What are the actionable opportunities?
- What are the outcomes you want them to have?
- Last, decide the key data points needed to support your story and apply appropriate visualizations.
David summarized this approach by referring to a famous Einstein quote:
“If I had an hour to solve a problem I’d spend 55 minutes thinking about the problem and five minutes thinking about solutions.”
 Last month we had the privilege of hosting David Ciommo, Data Visualization Principal at Humana, for a webinar, “Data Literacy: The Catalyst to Deeper Insights & Actionable Opportunities.” David’s career started in graphic design and has evolved into a passion for data literacy, data visualization, and data storytelling.
Watch David’s full presentation here.
