 Support
 Hey guys! Today, we’re going to talk about measures of central tendency in statistics
  . There are 3 types: mean, median, and mode. Let’s dive in!
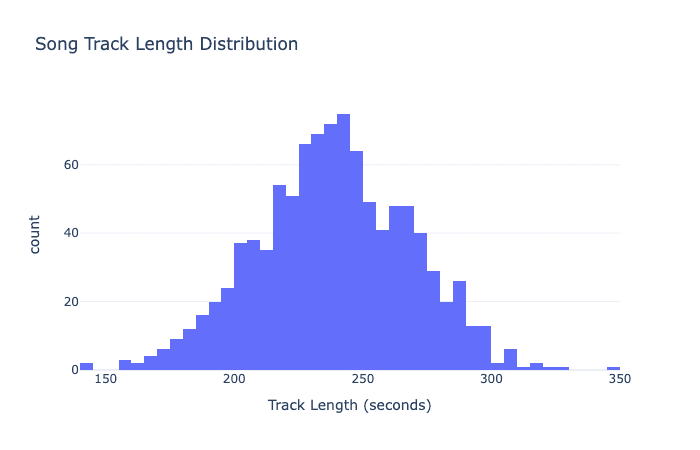
In a symmetrical distribution, the mean, median, and mode are all close to each other. It’s like a perfectly balanced see-saw with 3 people of the same weight on each side  . Check out this chart to see what I mean:
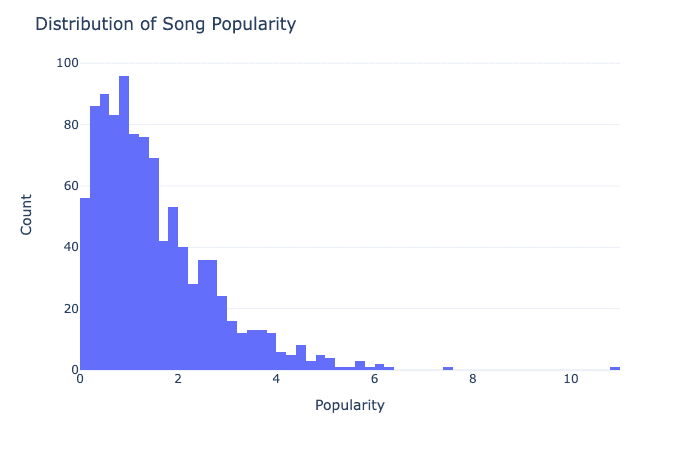
In a skewed distribution, the data is not evenly distributed, and the graph looks lopsided. The mean, median, and mode can be different from each other. Imagine a group of friends with different heights on a see-saw – it wouldn’t be balanced anymore  . Check out this chart to see an example:
Finally, when the mean and median are different, it means there are extreme values in the data set that are pulling the mean away from the median.  Imagine a pizza being split between friends – if one person takes a huge slice
  , it will make the average slice size bigger, even if most people only had small slices . The median is not affected by extreme values, so it gives us a better idea of what a “typical” value in the data set is.
So there you have it!  Now you know how to interpret measures of central tendency in symmetrical and skewed distributions. Keep on learning, guys!
